

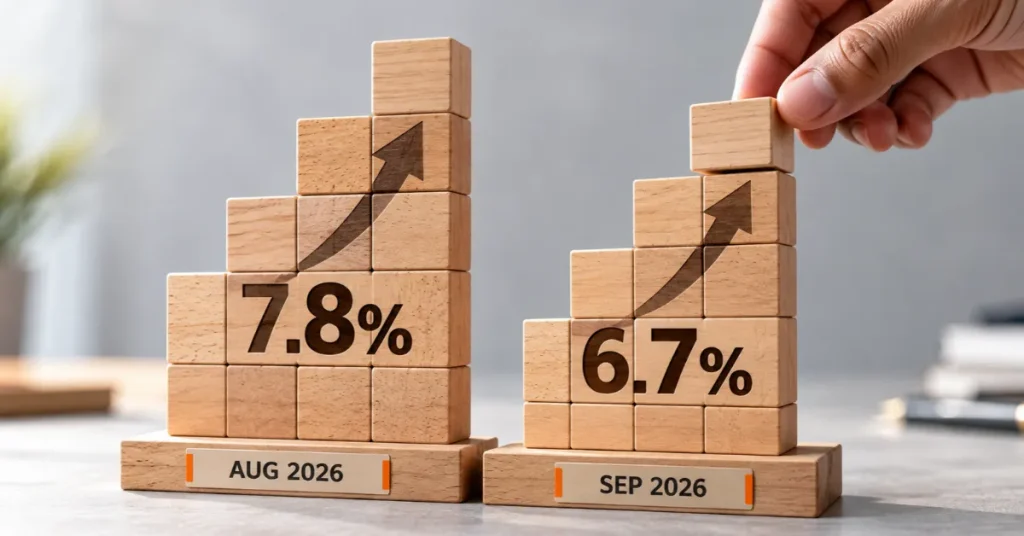
NEW DELHI, October 29, 2026: India’s industrial production increased by 6.7% in September compared with the same month last year, supported by growth in manufacturing and electricity generation, according to provisional data released by the Ministry of Statistics and Programme Implementation (MoSPI) on Wednesday. Manufacturing output expanded by 7.6%, while the combined electricity and gas supply sector recorded an 11.2% increase.
The figures show that industrial output continued to grow year-on-year, although the rate slowed from a revised 7.8% in August. Stronger production of motor vehicles, electrical equipment and industrial materials supported manufacturing, while mining and quarrying output contracted by 6.2%. The report also showed a 10.4% increase in capital goods production, an important indicator of activity in industries that make machinery and equipment used by other businesses.
September’s 6.7% growth was also below the 7.3% increase expected by economists surveyed by Reuters. However, industrial production expanded by 7.3% during July–September, compared with 6.2% in the preceding quarter. The figures show that while growth moderated in September, the broader three-month period recorded faster industrial expansion.
Devendra Pant, chief economist at India Ratings and Research, attributed the moderation partly to the comparison with the previous year’s production and weakness in mining. “Base effect and negative growth in the mining sector pulled down September growth,” he said, according to The Economic Times. A base effect occurs when the level of production in the corresponding period of the previous year influences the rate of growth reported for the current period.
The data comes from India’s Index of Industrial Production (IIP), which measures changes in the volume of goods produced across different industrial sectors. Unlike figures showing the total value of goods sold, the index tracks industrial output against a reference period, helping indicate whether production is expanding or contracting.
For September 2026, the IIP stood at 124.3, compared with 116.5 in September 2025, using 2022–23 as the base year. The resulting 6.7% growth is measured against September last year, not August this year.
The comparison with August requires care because the reported growth rates measure production against the corresponding months of 2025. A lower year-on-year growth rate does not necessarily mean industrial output fell from one month to the next.
Manufacturing remained the principal source of growth. The sector accounts for approximately 76% of the IIP’s weight, meaning its performance has a particularly large influence on the overall index. According to MoSPI, 17 of the 23 manufacturing industry groups recorded higher production in September than in the corresponding month of 2025.
Among the leading positive contributors was the manufacture of motor vehicles, trailers and semi-trailers, where output increased by 19.0%. The ministry identified passenger cars, commercial vehicles and automotive components among the product groups that contributed significantly to this expansion.
Electrical equipment manufacturing recorded even faster growth of 33.9%. Important contributors included electrical switching and protection equipment, such as circuit breakers and control panels, along with uninterruptible power supply equipment, solid-state drives and connectors used in optical fibre networks.
Rubber and plastics manufacturing expanded by 19.9%, supported by products including plastic sheets, tyres for light motor vehicles and industrial conveyor belts. These figures show that manufacturing growth extended across several industries supplying transport, electrical and industrial equipment.
However, the expansion was not uniform. Production of basic pharmaceutical products and preparations declined by 8.9%, while wearing apparel manufacturing contracted by 5.2%. Chemical manufacturing also recorded a marginal decline of 0.6%. These differences indicate that the overall manufacturing increase did not translate into growth across every industry.
Electricity production provided another important contribution to September’s industrial performance. Although the combined electricity and gas supply category grew by 11.2%, the two components moved in different directions.
Electricity output increased by 12.6%, with generation from non-renewable sources rising by 16.5% and renewable electricity generation increasing by 4.3%. Gas supply, in contrast, contracted by 6.7%. The combined sector’s strong performance was therefore driven by electricity rather than growth across both activities.
Mining and quarrying remained a weak point. Output in this sector fell by 6.2% compared with September 2025, following a 4.6% contraction in August. Within mining, non-metallic mineral production declined by 29.2%, while metallic mineral output increased by 14.0%.
The mining contraction weighed on the overall industrial growth rate, partly offsetting gains in manufacturing and electricity. Water supply, sewerage and waste management, another sector covered by the index, recorded growth of 5.8%.
Beyond individual industries, the ministry’s data also classifies production according to how goods are used. This provides a different view of industrial activity by separating products intended for further manufacturing, business investment, infrastructure development and household consumption.
Output of capital goods, including machinery and equipment used by businesses, increased by 10.4% in September. Growth in their production can indicate activity in industries linked to investment and capacity expansion.
However, higher capital goods output does not automatically establish that businesses increased their actual investment spending by the same amount. The index measures the production of these goods, not whether they were purchased, installed or put into operation. Capital goods growth also moderated from 15.9% in August, although it remained in double digits.
Intermediate goods recorded even stronger growth of 12.2%. These are materials and components used to manufacture other products rather than being sold directly to final consumers. Their expansion indicates higher production in industries supplying inputs to other businesses, although the figures alone do not establish how much additional demand came from domestic manufacturers.
Production of infrastructure and construction goods increased by 7.2%, while primary goods, which include basic materials and energy-related products, grew by 4.0%.
Consumer-facing industries showed a more uneven pattern. Consumer durables, which include longer-lasting goods such as appliances and other household equipment, recorded growth of 6.0%, compared with 10.5% in August.
Consumer non-durables, which cover frequently purchased or short-lived products, increased by 1.4% in September after contracting by a revised 1.1% in August. This marked a return to positive growth, although the pace of expansion remained modest compared with investment-linked and intermediate goods.
The difference suggests that growth in products used by businesses and industrial supply chains was stronger than in some categories of everyday consumer goods during September. However, production figures alone cannot determine the precise strength of household spending, since output can also be affected by inventories, imports and other factors.
Looking beyond the single month, India’s industrial production increased by 6.8% during April–September 2026, the first half of the 2026–27 financial year. This compared with 4.4% growth during the corresponding period a year earlier, indicating a faster rate of industrial expansion across the six-month period despite September’s moderation.
The latest figures use the revised IIP series with 2022–23 as its base year. Introduced in June 2026, the updated series expanded industrial coverage to include activities such as gas supply, water supply, sewerage and waste management, while providing more detailed information on electricity generation and mineral production.
MoSPI has cautioned that September’s figures are quick estimates based on production information collected from reporting agencies and industrial establishments. They were compiled with a weighted response rate of 86.5% and remain subject to revision as additional data becomes available.
The next IIP release, covering October 2026, is scheduled for November 30. It will provide another indication of whether the expansion in manufacturing and investment-linked goods continued, and whether the contraction in mining persisted.
Read also : India launches Punah Bharan app to find groundwater recharge zones within 3 km: how it works
Read also : India’s telephone connections rise to 136.79 crore: why the total includes more than mobile phones